Introduction
In this article we will see how to get logs and how to monitore a Kubernetes cluster.
Troubleshooting
Troubleshoot Clusters
The first thing to do is to list your cluster and check if everything is registered correctly :
kubectl get nodesAnd verify that all of the nodes you expect to see are present and that they are all in the Ready state.
To get detailed information about the overall health of your cluster, you can run:
kubectl cluster-info dumpThen, you can get useful logs in the following files :
Master:
- /var/log/kube-apiserver.log – API Server, responsible for serving the API
- /var/log/kube-scheduler.log – Scheduler, responsible for making scheduling decisions
- /var/log/kube-controller-manager.log – Controller that manages replication controllers
Worker nodes:
- /var/log/kubelet.log – Kubelet, responsible for running containers on the node
- /var/log/kube-proxy.log – Kube Proxy, responsible for service load balancing
Troubleshoot Pods
The first step in debugging a Pod is taking a look at it. Check the current state of the Pod and recent events with the following command:
kubectl describe pods ${POD_NAME}Look at the state of the containers in the pod. Are they all Running? Have there been recent restarts?
Continue debugging depending on the state of the pods.
Here are the most common Pod’s status :
- Init:N/M : The Pod has M Init Containers, and N have completed so far.
- Init:Error : An Init Container has failed to execute.
- Init:CrashLoopBackOff : An Init Container has failed repeatedly.
- Pending : The Pod has not yet begun executing
- Init Containers.PodInitializingorRunning : The Pod has already finished executing Init Containers.
To fetch logs, use the kubectl logs command as follows :
kubectl logs <podname>If your container has previously crashed, you can access the previous container’s crash log with:
kubectl logs --previous ${POD_NAME} ${CONTAINER_NAME}If none of these approaches work, you can find the host machine that the pod is running on and SSH into that host, but this should generally not be necessary given tools in the Kubernetes API.
Troubleshoot Services
Services provide load balancing across a set of pods. There are several common problems that can make Services not work properly. The following instructions should help debug Service problems. First, verify that there are endpoints for the service. For every Service object, the apiserver makes an endpoints resource available.
You can view this resource with:
kubectl get endpoints ${SERVICE_NAME}Make sure that the endpoints match up with the number of containers that you expect to be a member of your service. For example, if your Service is for an nginx container with 3 replicas, you would expect to see three different IP addresses in the Service’s endpoints.
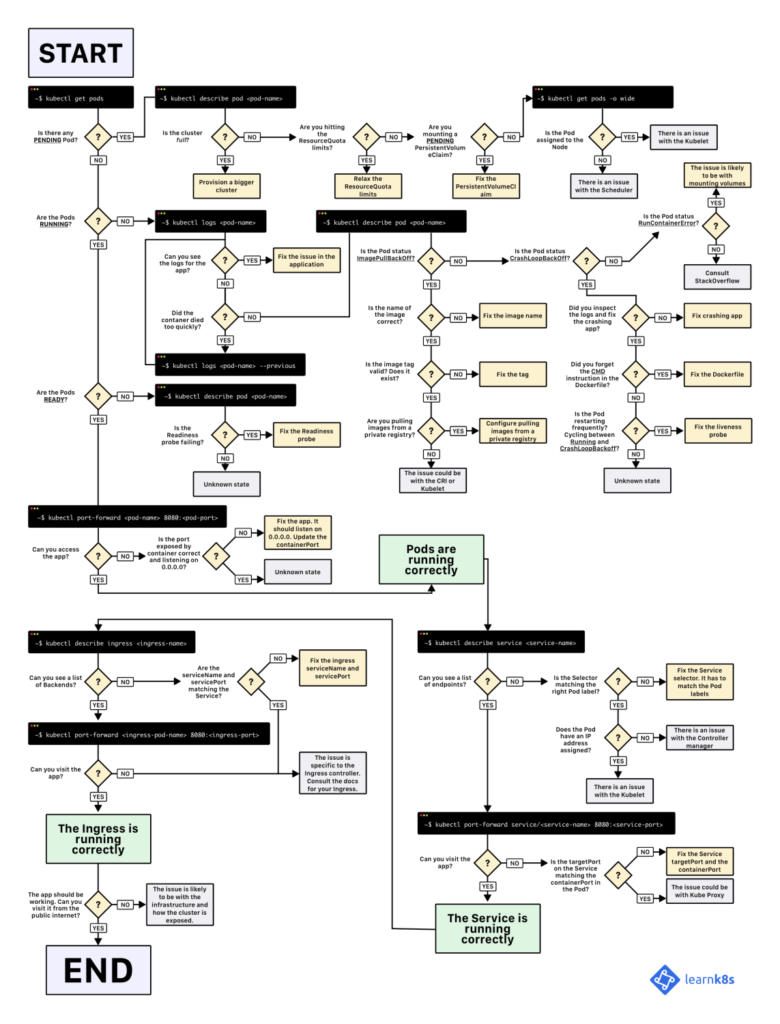
Workflow
This workflow can be very helpful if you are facing issues on your K8S cluster.

Kubernetes Monitoring
Resource usage metrics, such as container CPU and memory usage, are available in Kubernetes through the Metrics API. These metrics can be either accessed directly by user, for example by using kubectl top command, or used by a controller in the cluster, e.g. Horizontal Pod Autoscaler, to make decisions.
Metrics API
Through the Metrics API you can get the amount of resource currently used by a given node or a given pod. This API doesn’t store the metric values, so it’s not possible for example to get the amount of resources used by a given node 10 minutes ago.
Metrics Server
Metrics Server is a cluster-wide aggregator of resource usage data. It is deployed by default in clusters created by kube-up.sh script as a Deployment object. If you use a different Kubernetes setup mechanism you can deploy it using the provided deployment components.yaml file. Metric server collects metrics from the Summary API, exposed by Kubelet on each node. Metrics Server is registered with the main API server through Kubernetes aggregator. Learn more about the metrics server in the design doc.
Sources
kubernetes.io

