Introduction
In this last article we will see together how you can monitore and troubleshoot your Elasticsearch cluster. Let’s start with Elasticsearch Responses.
Elasticsearch Responses
HTTP Errors
As explained in previous articles, Elasticsearch uses the REST APIs. Several HTTP responses status can be displayed :

Index Response Body
Write operations like delete, index, create and update return shard information :
"_shards": {
   "total": 2,
   "successful": 2,
   "failed": 0
},
- total : how many shard copies the index operation should be executed on.
- successful : the number of shard copies the index operation successfully executed on.
- failed : the number of shard copies the index operation failed on.
- failures : in case of failures, an array that contains related errors.
Cluster Health
As seen in the previous article, you can get useful information with the cluster’s health.
In this example, API returns the following response in case of a quiet single node cluster with a single index with one shard and one replica:
GET _cluster/health
{
  "cluster_name" : "testcluster",
  "status" : "yellow",
  "timed_out" : false,
  "number_of_nodes" : 1,
  "number_of_data_nodes" : 1,
  "active_primary_shards" : 1,
  "active_shards" : 1,
  "relocating_shards" : 0,
  "initializing_shards" : 0,
  "unassigned_shards" : 1,
  "delayed_unassigned_shards": 0,
  "number_of_pending_tasks" : 0,
  "number_of_in_flight_fetch": 0,
  "task_max_waiting_in_queue_millis": 0,
  "active_shards_percent_as_number": 50.0
}
- cluster_name : The name of the cluster.
- status : The health status of the cluster.
- timed_out : If false the response returned within the period of time that is specified by the timeout parameter (30s by default).
- number_of_nodes : The number of nodes within the cluster.
- number_of_data_nodes : The number of nodes that are dedicated data nodes.
- active_primary_shards :The number of active primary shards.
- active_shards : The total number of active primary and replica shards.
The following is an example of getting the cluster health at the shards level:
GET /_cluster/health/twitter?level=shards
You can request the health of a specific index using the following syntax :
GET _cluster/health/my_index
Cluster Allocation Explain API
Elasticsearch provides the Cluster Allocation API (explain API) to help you locate any UNASSIGNED shards. The response lists unassigned shards and an explanation of why they are unassigned :
GET _cluster/allocation/explain
{
   "index": "my_index",
   "shard": 1,
   "primary": true,
   "current_state": "unassigned",
   "unassigned_info": {
      "reason": "INDEX_CREATED",
      "at": "2017-02-02T22:59:36.686Z",
      "last_allocation_status": "no_attempt"
   },
   "can_allocate": "no",
   "allocate_explanation": "cannot allocate because
   allocation is not permitted to any of the nodes”,
   ...
Elastic Monitoring
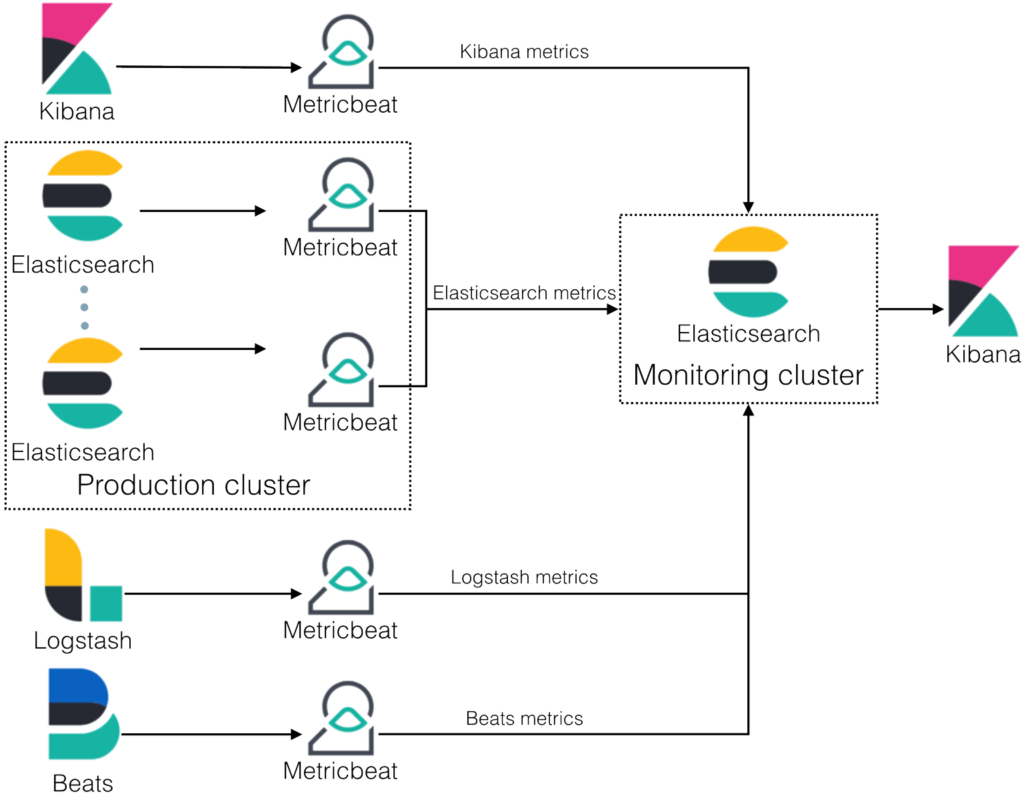
The Elastic Stack monitoring features provide a way to keep a pulse on the health and performance of your Elasticsearch cluster. It’s better to use a dedicated cluster for Monitoring to :
- reduce the load and storage on the monitored clusters
- keep access to Monitoring even for unhalthy clusters
- support segregation duties

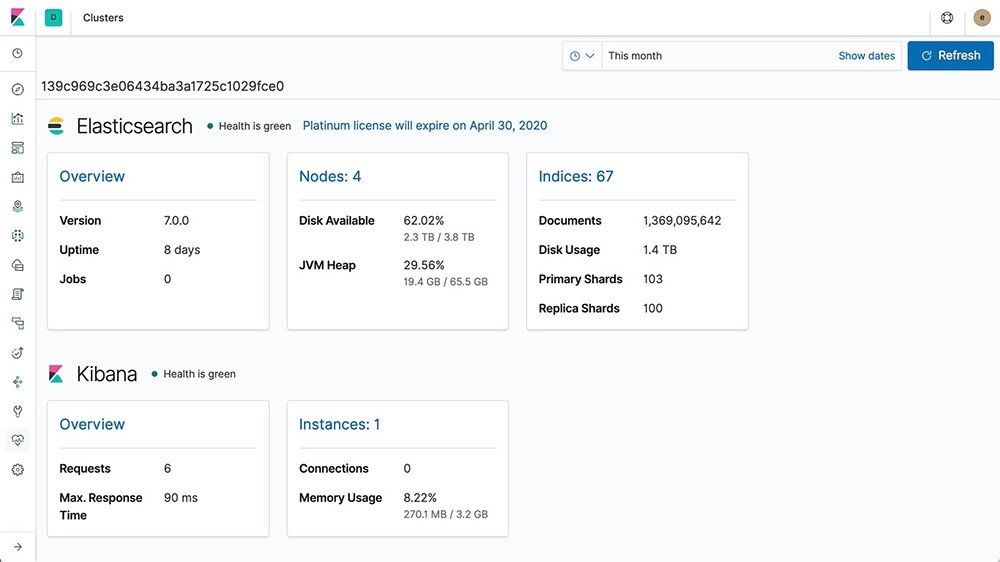
Here is what the dashboard looks like :

Diagnosing Performance Issues
Task management API
You can use the tasks API to see cluster-level changes that have not been executed yet. It will provide a nice view of how busy the cluster is :
GET _tasks

{
  "nodes" : {
    "oTUltX4IQMOUUVeiohTt8A" : {
      "name" : "H5dfFeA",
      "transport_address" : "127.0.0.1:9300",
      "host" : "127.0.0.1",
      "ip" : "127.0.0.1:9300",
      "tasks" : {
        "oTUltX4IQMOUUVeiohTt8A:124" : {
          "node" : "oTUltX4IQMOUUVeiohTt8A",
          "id" : 124,
          "type" : "direct",
          "action" : "cluster:monitor/tasks/lists[n]",
          "start_time_in_millis" : 1458585884904,
          "running_time_in_nanos" : 47402,
          "cancellable" : false,
          "parent_task_id" : "oTUltX4IQMOUUVeiohTt8A:123"
        },
        "oTUltX4IQMOUUVeiohTt8A:123" : {
          "node" : "oTUltX4IQMOUUVeiohTt8A",
          "id" : 123,
          "type" : "transport",
          "action" : "cluster:monitor/tasks/lists",
          "start_time_in_millis" : 1458585884904,
          "running_time_in_nanos" : 236042,
          "cancellable" : false
        }
      }
    }
  }
}
Identifying running tasks
The X-Opaque-Id header, when provided on the HTTP request header, is going to be returned as a header in the response as well as in the headers field for in the task information. This allows to track certain calls, or associate certain tasks with the client that started them:
curl -i -H "X-Opaque-Id: 123456" "http://localhost:9200/_tasks?group_by=parents"

HTTP/1.1 200 OK
X-Opaque-Id: 123456
content-type: application/json; charset=UTF-8
content-length: 831

{
  "tasks" : {
    "u5lcZHqcQhu-rUoFaqDphA:45" : {
      "node" : "u5lcZHqcQhu-rUoFaqDphA",
      "id" : 45,
      "type" : "transport",
      "action" : "cluster:monitor/tasks/lists",
      "start_time_in_millis" : 1513823752749,
      "running_time_in_nanos" : 293139,
      "cancellable" : false,
      "headers" : {
        "X-Opaque-Id" : "123456"
      },
      "children" : [
        {
          "node" : "u5lcZHqcQhu-rUoFaqDphA",
          "id" : 46,
          "type" : "direct",
          "action" : "cluster:monitor/tasks/lists[n]",
          "start_time_in_millis" : 1513823752750,
          "running_time_in_nanos" : 92133,
          "cancellable" : false,
          "parent_task_id" : "u5lcZHqcQhu-rUoFaqDphA:45",
          "headers" : {
            "X-Opaque-Id" : "123456"
          }
        }
      ]
    }
  }
}
Slow logs
Slow logs, thread pools, and hot threads can help you diagnose performance issues : https://www.elastic.co/guide/en/elasticsearch/reference/current/index-modules-slowlog.html
Profile API
You can profile your search queries and aggregations to see where they are spending time. The Profile API gives the user insight into how search requests are executed at a low level so that the user can understand why certain requests are slow, and take steps to improve them. (https://www.elastic.co/guide/en/elasticsearch/reference/current/search-profile.html)
Circuit Breakers
Elasticsearch contains multiple circuit breakers used to prevent operations from causing an OutOfMemoryError. Each breaker specifies a limit for how much memory it can use. Additionally, there is a parent-level breaker that specifies the total amount of memory that can be used across all breakers.
That’s all folks !
Sources :

